Virtual Prairie Quadrats
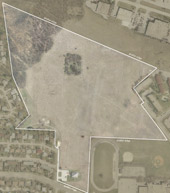
In 2003, fifteen sample sites were randomly selected within the preserve. Presence/absence and percent cover were recorded for each species using 1×1 metre quadrats in late spring and late summer. From this original data, four representative quadrats were chosen based upon species composition, diversity, and accessibility. During the 2004 field season, these quadrats were sampled and photographed on a weekly basis to document seasonal variation within the plant community of the tall grass prairie ecosystem. Photographic records taken during the 2004 field season were used to create the timelapse QTVR of each quadrat throughout the growing period.
What is a Quadrat?
A quadrat delimits an area in which vegetation cover can be estimated, plants counted, and/or species listed.
Plant Sampling Methodologies
When trying to determine the species and abundance of plants in an area, it is impossible to count each and every plant present. Instead, a number of samples can be taken from the area with the assumption that these samples are a good representation of the community in general. The selection of a sample site can be based on typical sites, random samples, systematic samples in a random pattern, or by a combination of random and systematic selection.
Random sampling is often carried out when the study area is relatively uniform, very large, and/or there is limited time available. Systematic sampling is used to show changes along a gradient, and involves taking samples at fixed intervals along a line or transect. Stratified sampling can be used when there are smaller areas within a larger study area which are significantly different.
Ultimately, the choice of sampling method will depend upon the type of data required, the size of the sampling site and financial/human resources available.
Quadrat Method
The most common sampling unit is the quadrat, which delimits an area in which vegetation cover can be estimated, plants counted, or species listed. The size, shape and number of the quadrats will depend upon the vegetation to be studied. A quadrat should be large enough to include significant numbers of individuals, but small enough so that plants can be separated, counted and measured without duplication or omission of individuals. When sampling prairie communities, for example, quadrat(s), 0.5 m2 to 2 m2, are commonly used.
Locations of quadrats within a stand may be determined systematically or randomly. Systematic sampling requires an even spacing of plots throughout the stand. To achieve this pattern, plots may be located at uniform intervals along evenly spaced transect lines. This procedure is easily employed and is thought by some to give a close approximation of the true characteristics of the stand. However, in order for valid statistical analysis to be carried out on the sampling data, the plot locations must be selected randomly, preferably through the use of a random numbers table.
Cover, density, and frequency are important aspects of the plant community which can be measured by quadrat sampling. Cover is the percentage of quadrat area beneath the canopy of a given species. Density is determined by the number of plants rooted within each quadrat. Frequency is the percentage of total quadrats containing at least one rooted individual of a given species.
Transect Methods
A variation of the quadrat method is the transect approach, in which a cross section of the area under investigation is used as a sample for recording, mapping and/or studying vegetation. These methods are often used for investigating and portraying changes in the composition of vegetation associated with environmental gradients. Transects help ensure that samples are taken from the entire sampling area, and are much easier to employ than laying out the grid necessary for proper quadrat placement.
The section can take the form of a one-dimensional line or a two-dimensional belt. With the line-intercept method, data is collected on plants lying on/under a straight line cutting across a community. Since area is not involved, density and cover estimates cannot be expressed on a per area basis. Relative values can, however, be calculated. A belt transect is a two-dimensional strip or swath through a vegetation area. It is particularly useful for studying obvious zonation patterns in vegetation. In some ways it is much like a very elongated quadrat.
Relevé or Sample Stand Method
Relevé is quick and non-mathematical sampling method which should detect nearly all plant species in a given community. For this method, a person knowledgeable with a region’s vegetation chooses several representative stands for a community, and records all species encountered. Cover is measured as a category, rather than a precise number. The relevé method can be considered qualitative in the sense that species cover is estimated and not measured, yet quantitative in that it gives a complete list of species for the plot.
Point Quarter Method
Point Quarter is an alternative sampling technique often used in forest communities. It is both rapid and easy to implement. The point quarter is an example of a ‘plotless’ method, involving only the choice of a number of points rather than plots. For this method, points are selected either systematically or randomly. At each point, the area around the point is visually divided into four quarters. In each of the four quarters, the nearest tree species name, circumference, and distance from centre is recorded. Density, basal area, and frequency may be determined through this method of sampling.
Distance Methods
Distance methods measure the distance from a sampling point (or plant) to the next nearest plant. The results of such a technique can provide important information about the relationships between plants, and can help determine whether plants are growing in discernible patterns or are randomly dispersed. Nearest Individual, Nearest Neighbour and Random.
Pairs are all examples of distance sampling methods.